The Best Candlestick Patterns Guide: Start Winning Trades!
Welcome to our comprehensive candlestick patterns guide, a definitive resource for mastering candlestick patterns trading. This guide delves into the intricate world of candlestick patterns, unraveling their meanings and demonstrating their pivotal role in market analysis.

Thanks for visiting Trading Strategy Guides (TSG)!
You have discovered the most extensive library of trading content on the internet. Our aim is to provide the best educational content to traders of all stages.
Learn Our Trading Best Strategy By our Founder Casey Stubbs
In other words, we want to make YOU a consistent and profitable trader.
If you’re a brand new trader, we recommend hopping over to our ultimate beginner’s guide to trading to learn more.
Whether you’re a seasoned trader or just starting out, understanding candlestick patterns is crucial for successful trading. Our guide explains the fundamental principles of these patterns.
Keep reading to learn more!
Table of Contents
Candlestick Patterns Meaning
If you learn how to trade using candlestick patterns, it can greatly improve your trading results, as each candle provides valuable information to traders.
It conveys a message on how to read and interpret the current status quo of price action. Being able to judge the communications of the market via the comprehension of candles provides a dangerous edge to all traders.
Once you learn how to read candlestick patterns, you will be able to determine the following stages of market behavior properly.
- Bullish Candlestick Patterns
- Bearish Candlestick Patterns
- Neutral Candlestick Patterns
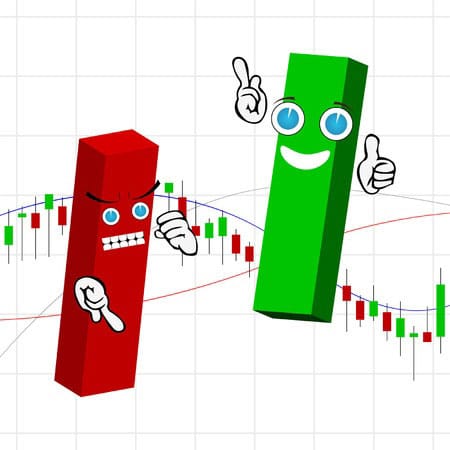
When analyzing Forex trading charts, each candlestick represents a specific period of time and provides information about the market’s behavior. A candlestick’s internal composition can indicate which side, the bears or the bulls, is dominating the market or whether the market is in a state of equilibrium.
By doing so, a trader can gauge the strength of a rally or fall or the absence of it. If you have the time to spend in the markets each day, candlestick patterns for day trading can be a great strategy to implement for your trading purposes.
Traders can use the candles to judge:
- Trend continuation
- Impulsive continuation
- End of trend
- Bearish candlestick patterns
- End of correction
- Breakouts
- Failed to break out
- Failed breakout failure
- Pullback
- Bounce
Candlestick Patterns Trading Basics
Let us start with the basics of candlestick patterns and calculating and recognizing the candle values. Each candle has an open, high, low, and close.
The proper way to analyze a candle is to compare the open, high, low, and close values and the relationship between them.
First, the close value minus the open value will determine whether the candle is bullish, bearish, or indecisive (equal values). This information will explain whether the candle is +20 pips or -100 pips, which is called the candle’s body.
Second, the difference between the high and close/open and the difference between the low and close/open will determine the size of the wicks on both ends (could be 0 (zero) as well), which is called the wick of the candle.
You calculate a total candle value by subtracting the high from the low. A ratio is computed when dividing the size of the candle body/wick by the entire candle length. This ratio will provide information regarding the balance of the power in that particular candle.
Who’s in Control?
Now let’s discuss what information the ratio and balance of power within a candle convey: who controls the market?
1. Power from one side: This usually happens when a candle has little or no wick. The wick should be not too small (preferably less than 10-20% of the candle body). Moreover, the wick is only necessary for closes near highs in bullish cases and closes near lows in bearish cases.
- A close near the high/low (h/l) within +/- 0-10%: total control.
- A close near the h/l within +/-10-20%: good control.
- A close near the h/l within +/-20-30%: some control possible (depends on context).
- A close near the h/l within +/-30-40%: questionable/no control (depends on context).
- A close near the h/l within +/-40+%: no control from one side.
2. Loss of control from one side: This happens when the candle has one big or decent-sized wick. If the wick is on top, then the Bulls lose control during the candle. However, if the wick is on the bottom, then the Bears lose control during the candle. The wick percentage of the total candle size shows how much control was given away during that price struggle:
- A wick of +/- 0-20% indicates little loss of control.
- A wick of +/-20-40% indicates some loss of control.
- A wick of +/- 40-60% indicates loss of control.
- A wick of more than 60% is a major loss of control.
3. Loss of / no control from both sides: This happens when the candle has two wicks on both sides. There is no clear winner, and the bulls and bears remain in balance. The open and close are often equal to each other or almost equal to each other (small body), which indicates indecision.
Key Aspects of Candlesticks
Besides the fact whether a candle has a bullish or bearish net gain, whether the close is near the h/l, whether there is a wick, which side(s) there is a wick, what percentage of the candle is the wick and body, it is also essential to look at the size of the candle.
A big-sized candle will have more value than a small-sized candle. Of course, this depends on the time frame. A candle size of 40 pips is a massive sized candle for the 1-hour chart but not for the daily (small).
Usually, the larger the candle, the more strength and information the candle will give, and that helps make a trading decision.
The timeframe itself is, of course, also necessary. Moreover, the higher the time frame, the more valuable the information can become because the candle provides an understanding of the balance of power over a longer period.
For example, the effect of a primary wick on the daily chart indicates a massive loss of control during the entire day, which has more importance than a wick on a 15-minute chart (Bear/Bulls losing control for only 15 min).
When the candlestick patterns are printed, it is also another factor of analysis.
A daily candle printed on Sunday is usually small and provides no information. However, a 1-hour candle written at 1 am GMT on the EUR/USD with a seven-pip body also has little value.
Last but not least, the candle needs to be closed before an assessment can be made of the candle itself. When a candle is open, it can close anywhere it wants to. It is certainly possible to analyze that candle, but when it is open, a trader is trading/analyzing a lower time frame.
Candlestick Patterns Trading in Action

As explained in the previous paragraphs, each candle provides a valued source of information on whether the market remains/changes to bullish, bearish, or indecisive.
Some of the candlesticks, however, do offer more value than others. These candlesticks have various names because they are of more importance than regular and “normal” candles.
Certain candlestick patterns consist of one candle. Other candlestick patterns need two candles to be complete or even up to three candles to form a combination formation.
Candlestick Patterns in Market Structure
Candlesticks are the building blocks of what will later become a swing high or swing low. In turn, the swing or swing low can either be impulsive / momentum OR corrective / consolidation.
Furthermore, the candlestick patterns usually occur at the bottom or top of these swing highs and swing lows but can also provide continuation information. Also, candlestick patterns often indicate the beginning and end of momentum and corrections.
The various swing highs and swing lows labeled as momentum and correction can, in turn, be the building blocks of a trend channel, trend line, and chart pattern.
Various Ways to Use Candlestick Patterns in Strategies
You can effectively use candlesticks for trading Forex strategies. How to use these candles will differ from strategy to strategy and trader to trader.
Some Forex traders even opt to trade solely based on the information provided by candlesticks. They make their analysis and trading decisions/management based on the candlestick patterns. An example could be, for instance, trading pin bars.
Other traders use candlesticks as supportive information. They seek confirmation of their analysis via candlestick patterns. For example, traders could wait for a bounce at a trend line by analyzing candles. This strategy means that traders use candles as part of a broader strategy and use them as confluence.
Price action signals at major support and resistance, for instance, is a method that capitalizes on candlestick patterns in combination with other technical analyses.
Lastly, some traders may choose not to use candlestick patterns because they prefer other concepts. All traders need to find a balance in their tools, indicators, and analysis.
Candlestick Patterns Guide Video Training
I have posted this video if you are interested in becoming a more advanced candlestick trader.
What Type of Candlestick Pattern Do You Use?
As we conclude this candlestick patterns guide, we hope you’ve gained valuable insights into the art of candlestick patterns trading. It’s important to learn and understand each type of candlestick pattern, including the Japanese candlestick patterns.
These insights are instrumental in enhancing your trading strategies and decision-making processes. Remember, the journey of mastering candlestick patterns is ongoing, and this guide serves as a strong foundation to build upon your trading endeavors.
Do you use Japanese candlestick patterns for analysis and trade management? If yes, are there any particular candlestick patterns you like most? If not, why not? Let us know down below!
Thanks for reading, and feel free to share this candlestick patterns training article.
Good luck trading!




Yes, I use candlesticks for my analysis as well as for trade management – mostly the main patterns including bearish/bullish engulfing , twizzer tops and bottoms, pinbars, head & shoulder patterns, triangles and flag pole patterms. They work well! A great article!
I use candlesticks now, too – I lost so much money trading, I can’t pay for electric lights anymore.
Funny one Jack 🙂 I missed this from before.
I’m a beginner. Now I’m learning how to trade candlesticks. Your post is very helpful for me. Thank you, Mr.Casey!
Thank you!