Simple Moving Average Secrets: Discover 3 Hidden Tips for Successful Trading

In this post, we will be sharing with you three powerful and simple moving average secrets that can help you take your trading to the next level when using the moving average indicator. These secrets are not known by many traders and can provide you with a significant edge in the markets.

Thanks for visiting Trading Strategy Guides (TSG)!
You have discovered the most extensive library of trading content on the internet. Our aim is to provide the best educational content to traders of all stages.
Learn Our Trading Best Strategy By our Founder Casey Stubbs
In other words, we want to make YOU a consistent and profitable trader.
If you’re a brand new trader, we recommend hopping over to our ultimate beginner’s guide to trading to learn more.
By delving deeper into the world of trading, our exploration will uncover the nuanced dynamics of the moving average, a tool often overlooked yet brimming with potential. Through careful analysis and expert insights, we aim to illuminate the lesser-known aspects of this indicator.
We want to offer a fresh perspective to both novice and seasoned traders alike. This journey promises to reveal strategies that can redefine your approach to the markets, enhancing your trading acumen.
Keep reading to learn more!
Table of Contents
What Are the Three Powerful Moving Average Secrets?
The first secret is using simple moving averages as great reversal or retracement targets and identifying divergence. By understanding how to use moving averages in this way, you can improve your ability to identify potential turning points in the market and make better trading decisions.
Next, the second secret is the dynamics of gravity and speed. This secret will reveal how to use moving averages to measure the force and speed of price movements, giving you an edge in identifying trend strength and potential trend reversal.
Lastly, the third secret is the difference between using Exponential Moving Averages (EMA) and Simple Moving Averages (SMA) and when to use them. You will learn that Exponential Moving Averages for support and resistance can act like quicksand in your trading and how to use the support and resistance levels to avoid falling into the traps.
By understanding these simple moving average secrets, you will be able to use moving averages in a more powerful and effective way. Let’s dive in and discover these hidden benefits of the moving average.
What Is a Moving Average?
A moving average is commonly used as a technical indicator in finance and trading. Briefly defined, it is a statistical measure used to smooth out the fluctuations in a data set, such as stock prices, and provide a clearer picture of the underlying trend.
To calculate the moving average, you need to take the average of a specific number of data points over a certain period of time.
The Types of Moving Averages
There are many different types of moving averages, each with its own unique characteristics. However, explaining them all goes way beyond the scope of this article.
The most commonly used moving average is the Simple Moving Average (SMA), which is calculated by taking the sum of the closing prices over a specified number of time periods and then dividing by the number of time periods.
Another popular type is the Exponential Moving Average (EMA), which places more weight on the recent data points, making it more responsive to recent price changes.
Different Ways to Use the Simple Moving Average Secrets
Simple moving average secrets can be used in various ways, the most common being to identify the overall trend of the market. When the current price is above the moving average, it is considered to be in an uptrend.
When the current price is below the moving average, it is considered to be in a downtrend. Additionally, moving averages can be used to identify support and resistance levels, which can be helpful for making buy and sell decisions.
Moving averages are popular tools for technical analysis and are widely used in trading. They can be used in combination with other indicators to form trading strategies. Also, they can be adjusted to suit different trading styles and time frames.
However, it’s important to note that moving averages are lagging indicators, which means that they are based on past data, so they can’t predict future price movements. They are also known to give false signals in markets that are choppy and volatile.
In essence, a moving average is a technical indicator that helps traders identify the market’s overall trend, support and resistance levels, and make buy and sell decisions. It is calculated by taking the average of a specific number of data points over a certain period of time.
Furthermore, it is essential to note that moving averages are lagging indicators and should be combined with other indicators to better understand market trends.
Why Should I Use the Moving Average?
The moving average is a great indicator, primarily because of its simplicity. It is also due to its ability to produce various types of analysis. The combination of simplicity, depth, and other characteristics, such as consistency (calculated the same way) and dynamics (moves along with price), make it a win-win for all traders.
The best moving average setting has great value in understanding the following scenarios:
- Whether there is a trend in play: Price and various moving averages are aligned in a trending environment.
- When a retracement or reversal occurs: The price returns to the average in a retracement/reversal scenario.
- Where there is a lack of a trend: In a range mode, the (long-term) moving averages are flat or close to flat.
However, there are more hidden moving average tricks to technical analysis!
The Criticisms of Moving Averages
Before diving into it, let’s discuss the criticism regularly given to moving averages.
Traders usually point to the fact that moving averages are lagging. Therefore, it is not a worthwhile indicator. Nobody can dispute the fact that they are lagging. It is a costly miscalculation if a trader discards moving averages as a viable indicator.
By using our simple moving average secrets together, with multiple time frame analyses, a trader can greatly benefit from this seemingly too simple indicator.
How Moving Averages Work
Most traders use moving averages to determine trends and potential support and resistance levels. As we know, one of the ways moving averages work is to smooth data and have a better view of the market trend that is in play.
Most of us use specific price data, such as 20, 50, or 100 periods or any time period that suits a particular trading style. However, the moving average is a lagging indicator since it’s based on past price data.
Both leading and lagging indicators have their own merits. In this regard, the moving average is seen as a great trend-following indicator. You can learn more about leading and lagging indicators here: Best combination of technical indicators.
Trading using moving averages works better in trading markets than in the ranging market. In a ranging market, the price has the tendency to cross a moving average above and below over and over again.
Also, if you’re using moving average crossovers to enter trades, you’ll experience a lot of false signals in a ranging market.
Here is an example:
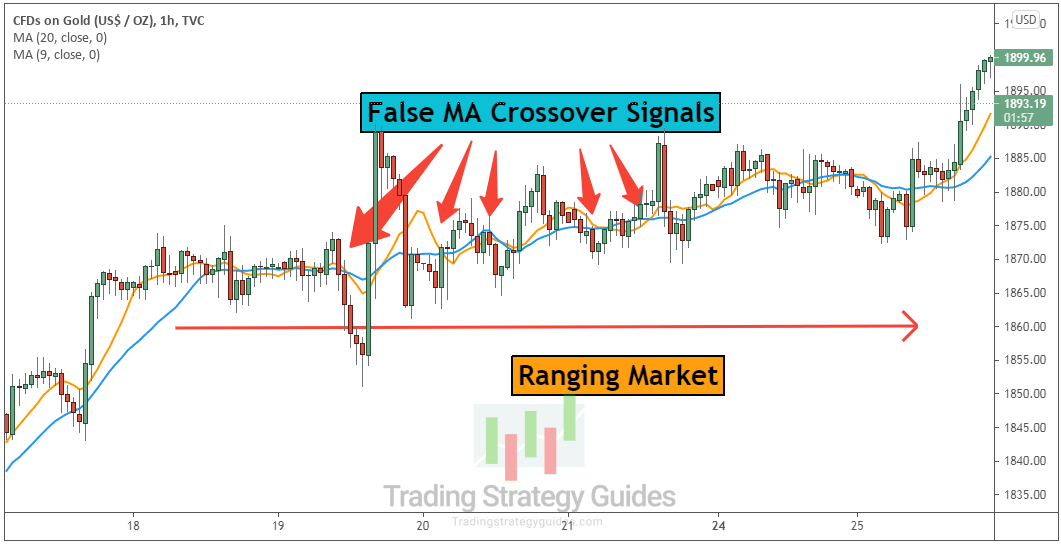
So, the key takeaway is to try to use the moving average in a trending market. Moving on, let’s look at how a simple moving average is calculated.
How Is a Moving Average Calculated?
The moving average is calculated by averaging the closing prices of securities over a certain period. Moving averages can be used as input for any of the open, high, low, and close prices (OHLC prices). However, most traders prefer applying the moving average to a bar’s close price.
Here is the moving average formula:

We’ll review an example to better understand how a moving average gets printed on your price chart.
Let’s suppose a security be it a stock, a currency pair, or a cryptocurrency, posts the following closing prices:
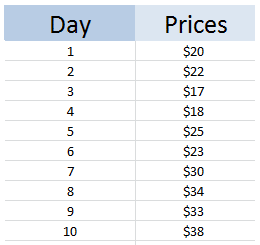
If you’re a day trader, you’ll probably be using a short-term moving average like the 5-period moving average.
We can calculate the value of the 5 MA at day 10 as being 31.6.
SMA = ($23+$30+$34+$33+$38)/5= 31.6
We simply took the previous five closing prices and smoothed out the price by finding the average of those prices.
Now, if you’re using a 10-period moving average, we need to use the closing prices from the previous 10 candles.
SMA= ($20+$22+$17+$18+$25+$23+$30+$34+$33+$38)/10=26
So, the current value of the 10-period MA is 26.
By comparison, the price is closer to the 5-period MA ($31.6) versus the 10-period MA ($26). This makes sense because the short-term moving average follows the most recent prices, whereas the 10-period MA takes prices from further back into account.
The EMA calculation is a bit more complex by comparing simple moving averages vs exponential moving averages.
Here is the formula for the exponential moving average:

Moving on, Let’s explore the different ways to use moving averages.
How Do Moving Averages Work to Serve as a Forecast?
Several simple hidden moving average strategies can help traders make more sense of the price action. Without further ado, the moving average is helpful in identifying:
- The direction of the trend
- Support and resistance levels
- A shift in the trend direction
- A place to hide your trailing stop-loss order
- Mean reversion levels
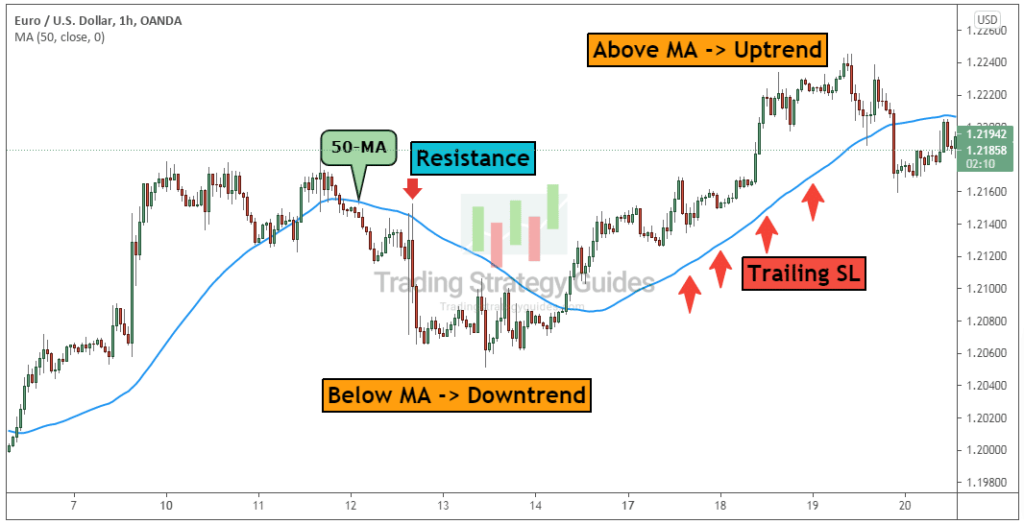
The best way to figure out which moving average strategy is best for you is to experiment with them all until you find one that fits your trading style.
Using moving averages with other strategies can help you make a better prediction. For example, the moving average and stochastic strategy work great together when you try to navigate the ups and downswings in the price.
Next, we’ll share with you the promised three secrets that can help you transform your trading.
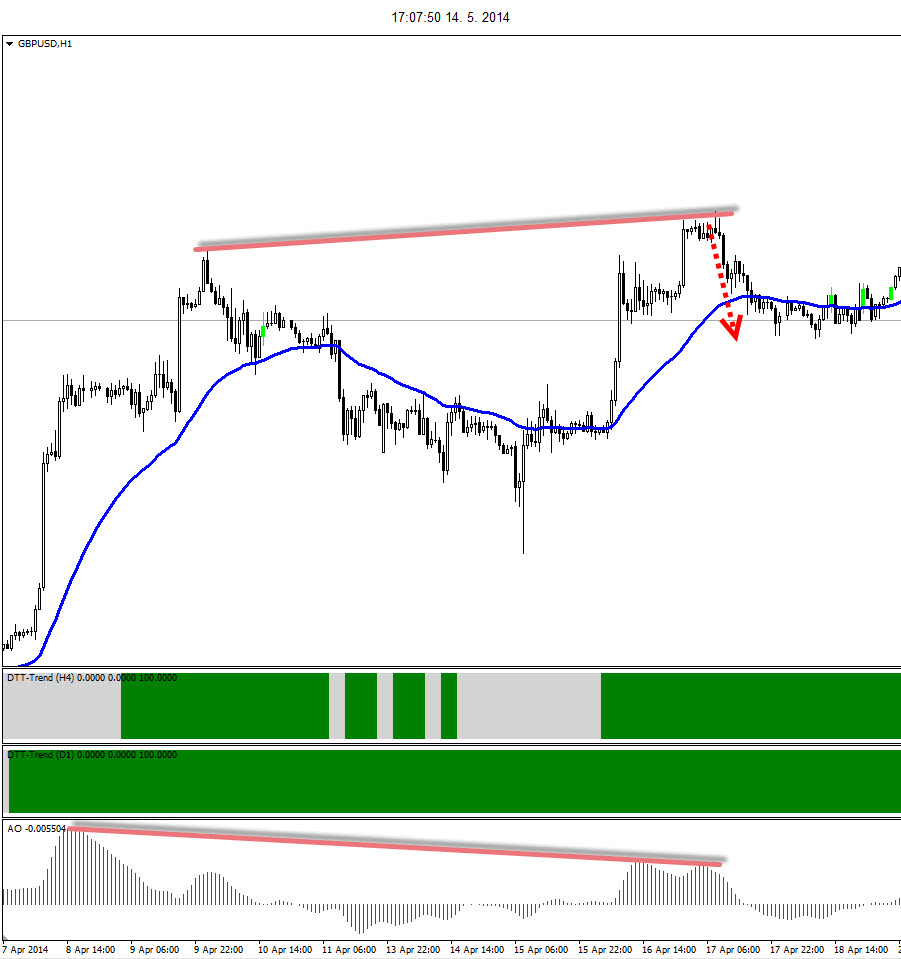
Secret #1: Trading Divergence with Moving Averages – Great Reversal/Retracement Targets
Trading divergence with moving averages provides us with solid targets! As price builds on a trend with either higher highs and lows or lower lows and highs, the trend eventually reaches exhaustion. This is due to the momentum fading away with each subsequent newer higher or lower.
Feel free to read about the Divergence trading strategy.
The interesting point is: did you have a particular target in mind when trading divergence with moving averages? (For reversal traders, this could take a profit place; for trend traders, this translates into how long the filter is valid).
Moreover, the moving average tricks for technical analysis are that, on average, when divergence appears, a trader can expect the price to retrace at minimum back to an intermediate moving average (anywhere between 100 and 150 ema).
The interesting point is: did you have a particular target in mind when trading divergence with moving averages? The hidden secret is that on average – when divergence appears – a trader can expect the price to retrace… Click To Tweet
Obviously, it’s possible that the price can sometimes miss the moving average band. However, only if the price hits or comes close to these moving averages can a trader consider the trading divergence with moving averages to be irrelevant for future price movements.
Secret # 2: Gravity and Speed Bring Prices Back to Earth
This is another one of our moving average tricks for technical analysis. Not everyone is a big fan of physics, and I am one of them as it’s tough material.
However, gravity is a concept that has a simple effect on our lives. We stick to our planet Earth because of it.
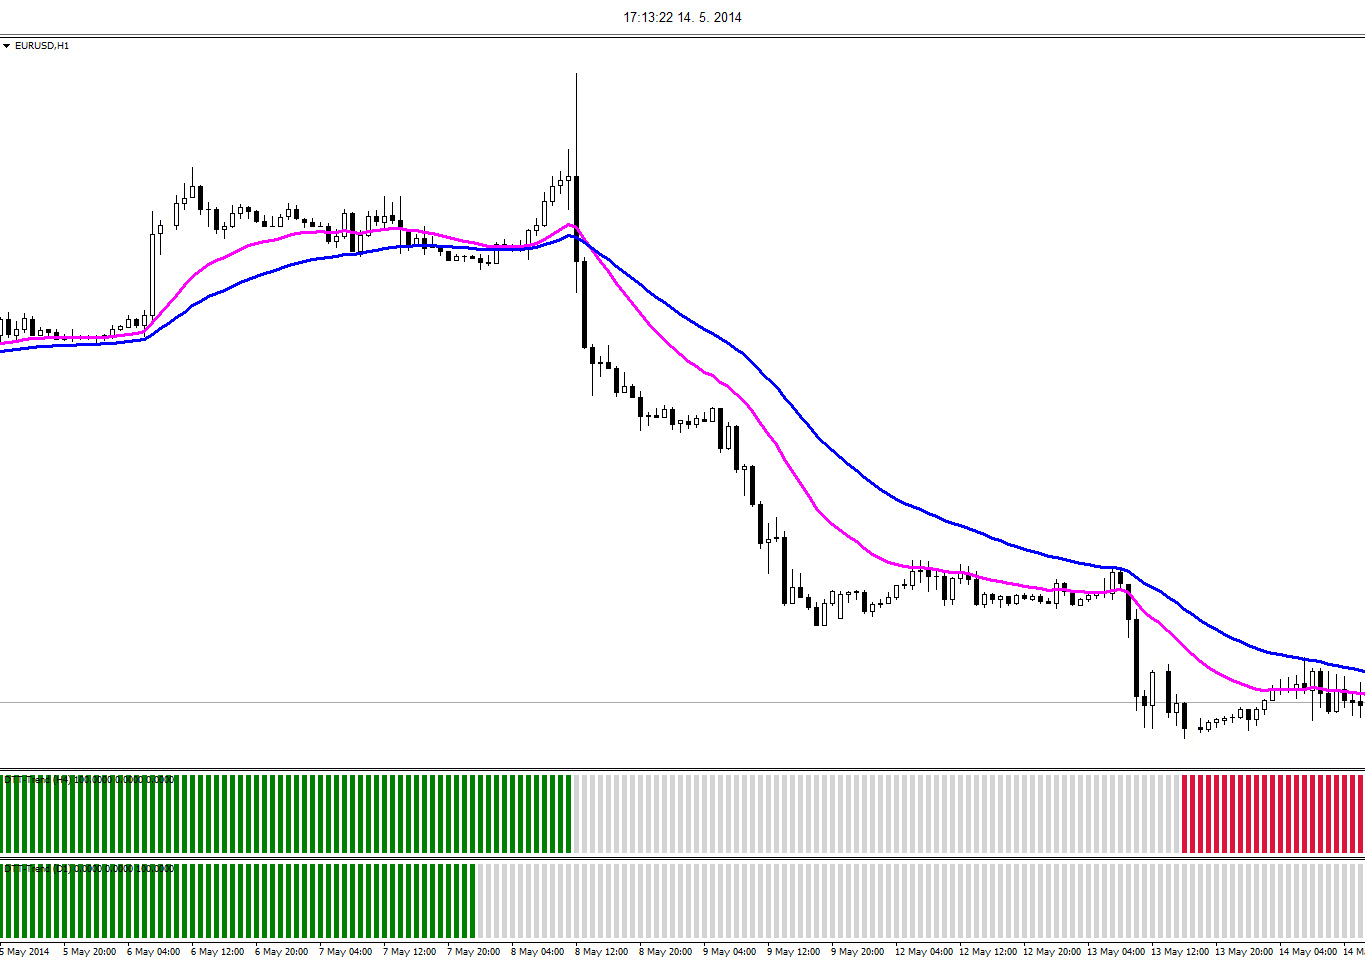
Price and moving averages have a similar relationship to each other as humans have with the Earth. Here is my modest explanation of physics.
As humans gain speed, we can temporarily jump away from the planet despite the effects of gravity. When we lose speed, gravity pulls us back to the Earth. The more speed we have, the further and higher we can jump. Michael Jordan is the best example of this.
The same can be said about price and moving averages. When the price has more momentum (speed), it can travel more distance away from moving averages before being pulled back due to the moving averages, and gravity kicks in.
When the price has a little momentum, it cannot go far before the gravity of the moving averages pulls it back to its average.
When the price has more momentum (speed), it is able to travel a further distance away from the moving averages before being pulled back and gravity kicks in. When the price has a little momentum, it is unable to go… Click To Tweet
The angle of two faster-paced moving averages and the difference between them will indicate whether the price has sufficient speed to break away from its average.
Furthermore, the best moving averages for momentum readings are ones between five and a maximum of 40 ema. A trader could choose five and 10 EMA, for instance, or 10 and 20 EMA or 20 and 40 EMA closes. The gap between the two ema’s will indicate the momentum and hence the speed of price.
Our SMI momentum indicator would do the same, of course, but with less effort on your side.
Secret #3: Exponential Moving Averages for Support and Resistance – Acting like Quicksand
The simple moving average hidden secret #2 revolves around the speed part of the equation. This section focuses on the gravity part. How does a Forex trader know whether gravity is in play and how strong it is?
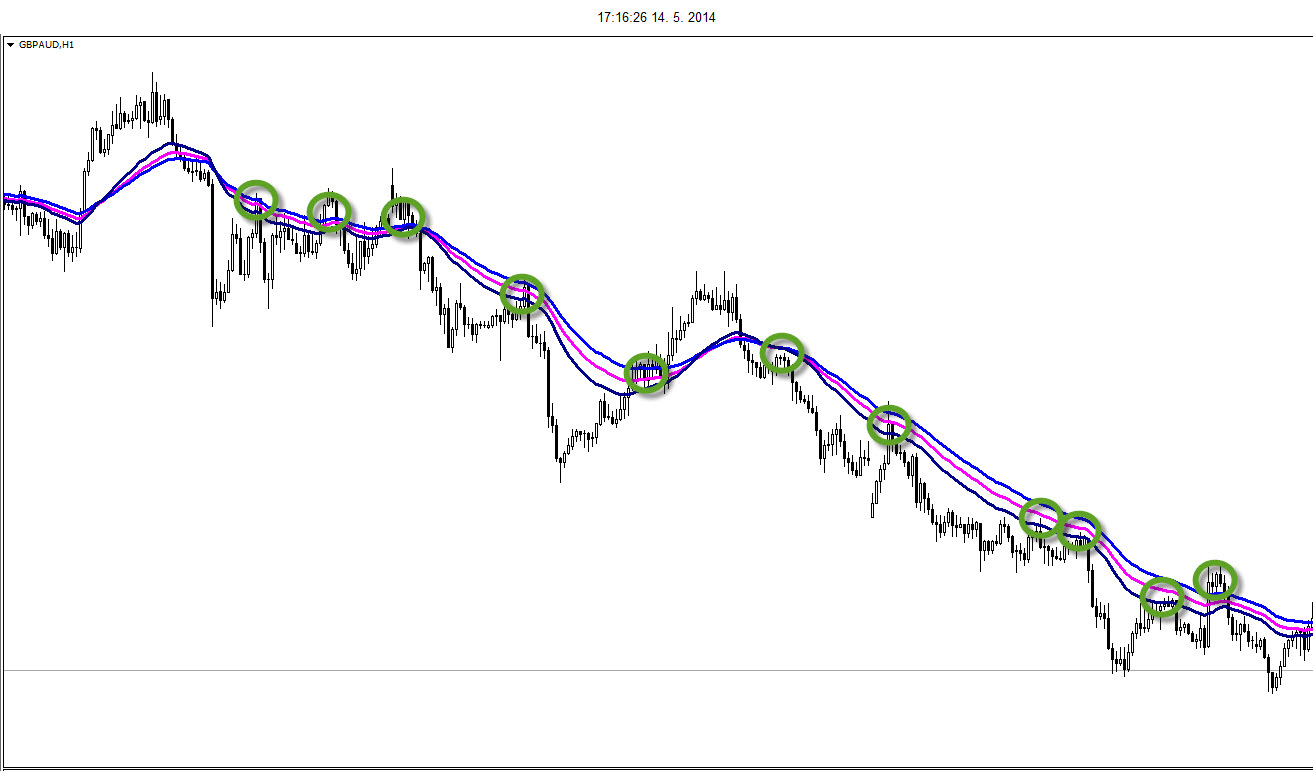
The answer is simple: check the angle of the moving averages.
How does a Forex trader know whether gravity is in play and how strong it is? The answer is simple: check the angle of the moving averages. Click To Tweet
In this case, intermediate moving averages are the best for representing gravity. Anything between 30 and +/-80-100 EMA would do well.
If the moving averages are FLAT and have NO angle moving averages, they have a very high gravity pull. The price will have many problems trying to move away from the average.
Suppose the moving averages are ANGLED and NOT flat moving averages. In that case, they have a shallow gravity pull. The price will succeed quicker in trying to move away from the average.
Furthermore, the moving averages turn into dynamic support and resistance. When the price does get back to them, these levels can be used as a rough area for trend continuation (bouncing area due to support and resistance).
Here is a strategy you can read about, and it’s called the risk-to-reward ratio.
Final Words about the Simple Moving Average Hidden Secrets
For some of you, the simple moving average secrets are well-known, and for others, they may be new. Despite that, what do you think of the above concepts, and what are your experiences in trading?
Our team at Trading Strategy Guides wants to provide the best content for your Forex trading and appreciates any and all feedback.
By the way, next time, we will continue with our moving average discussion and explain how we can use the indicators in multiple-frame analysis!
Thank you for reading!
Please share your comments on moving average secrets for successful trading that we may have missed! Leave a comment below if you have any questions about moving average tricks for technical analysis.
Frequently Asked Questions
Is the Moving Average a Good Indicator?
Yes, the moving average is an excellent technical indicator because it smooths out the price data and gives you a clear view of the trend without the noise. Moving average strategies are extremely popular tools for identifying long- and short-term market trends.
Which Moving Average Is Best?
The best moving average is the 200, 100, 50, and 20-period moving average. Other popular combinations of moving averages include 50 and 100 MA, 50 and 200 MA, and 10 and 20 EMA.
Which Moving Average to Use?
If you’re a short-term trader, you should use moving averages with 5 to 20 periods. However, if you’re a swing trader, you should use the moving average with 20 to 80 periods. Using the moving average with 100 to 250 periods is best for long-term traders.
Which Moving Average Do You Use for Day Trading?
The best-moving average for day trading is the 5, 8, and 13 periods MAs. These are fast-paced moving averages suited for day traders seeking to buy and sell signals across all intraday time frames.
Which Moving Average Is Best for the Long Term?
The best-moving average for long-term traders is the 200-day exponential moving average. Moreover, the 200-day EMA is regarded as the most important barometer of whether securities are in an uptrend or a downtrend.
Which Moving Average Should Be Used for Swing Trading?
Well, the best-moving average for swing trading is the 20-period MA. The 20-day moving average has been the tool of choice, helping swing traders gauge the trend’s direction.
Which Moving Average Is Best for Scalping?
The best-moving average for scalping is the 5 and 8-period MAs. Furthermore, the 5-moving average adds more reliability to your day trading strategy. This is a very fast-moving average that is very sensitive to short-term changes in price.
Which Moving Average Is Best for the 5-minute Chart?
The best-moving average for the 5-minute chart is the 12-period MA. Moreover, the 12-MA would average out the closing prices for the last 12 candles, which sums up 1 hour of trading activity.




Great really its helpful
great insight.
it was wonderfull
thanks
Thanks for explaining the EMA in details ,I really appreciate your effort .thanks
Todavia hay mas sobre el uso de las medias móviles:
1.-Cuando sabemos que entramos , estamos y salimos de de un rango lateral:medias móviles entre cruzadas entre si , si son de bajos periodos moviles (10-20) y serán planas , si son de altos periodos.(150-300)
2.-También sobre el cruce de medias a la baja o al alza.
3.-Confluencia de medias móviles con soportes y resistencias.
Quite an insightful write-up
Thank you!
I have beem
This didn’t define what a “flat” moving average actually is. Thanks for the info though.
A flat moving average is basically where there isn’t much movement and you have a lack of a trend. Not trending up or down. Hope that helps.
e
e
e
e
Interesting. I need to back test the same on Nifty and Forex. Need your support for guidance. Thank you Sir. Best Wishes
e
e
e
what is with all the “Es” We want in! 🙂